
Any useful bitcoin price prediction this week has to account for one number that is not on the chart: $2.58 billion has left the United States spot bitcoin ETFs across the 12 trading sessions since November 2.
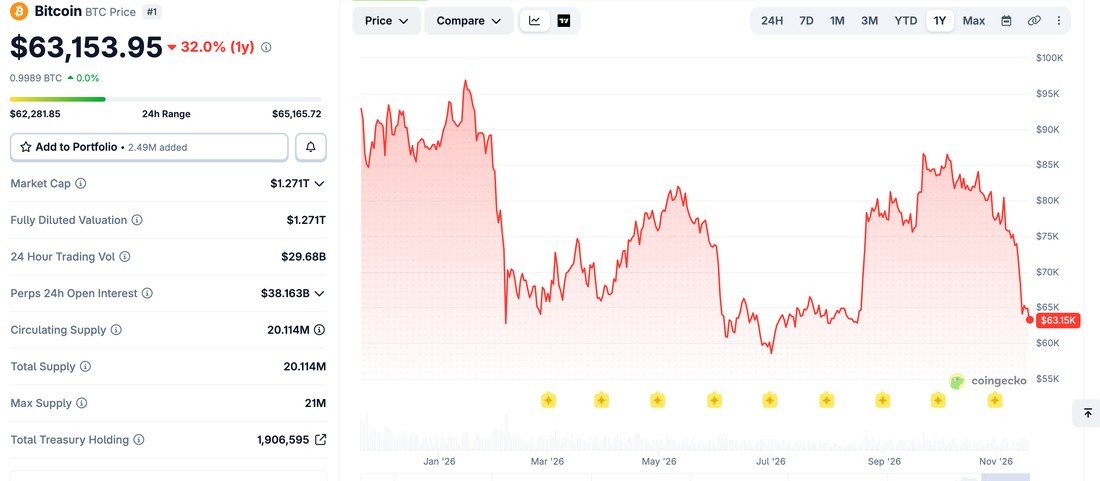
Bitcoin sits near $63,200 as a result, which is roughly half the $126,080 it reached in October 2025. The $62,612 low set on Sunday has held, and a ceiling near $65,607 has not been beaten since.
One Fund Is Doing Almost All of the Selling
The withdrawals are far less broad than the headline figure suggests. BlackRock’s IBIT accounts for $2.25 billion of the $2.58 billion, which is 87% from a single product.
- The other 11 spot funds have shed $328.1 million between them over the same 12 sessions
- November 16 was IBIT’s only positive day in that run, at $76.5 million in
- Tuesday alone took $239.9 million out, bringing the five-day total past $1 billion
- November is the heaviest month of withdrawals since June, when $4.51 billion left
Those redemptions land on a market that was already thin. About $2 billion of leveraged positions were liquidated over the weekend, and funding on perpetual futures has flattened to 0.006%, which says the leverage that remains costs almost nothing to carry.
Bitcoin Price Prediction: The Levels on Either Side
Bitcoin is below its 20-day, 50-day and 200-day averages at once, which leaves horizontal levels doing all the work.
| Level | Price | Why it matters |
|---|---|---|
| $72,784 | 200-day average | Defines the longer trend, far overhead |
| $70,000 | Last held close | No daily close above it since November 13 |
| $66,583 | Strong resistance | Must break before $70,000 is arguable |
| $65,607 | First resistance | Has turned back every bounce this week |
| $63,200 | Spot | Price on November 19 |
| $62,361 | Strong support | Sits on the lower Bollinger band at $62,322 |
| $58,500 | June low | Opened by a daily close under $62,000 |
The 50-day average is up at $78,700 and the 20-day at $72,882. Bitcoin has also printed 13 straight sessions of lower daily highs, which is the longest such run it has recorded, and trade over the past day has been squeezed into $62,282 to $65,166.
Year to date the funds are now about $1.98 billion in net withdrawals, which erases the accumulation built up earlier in the year. The MACD on the daily chart sits at minus 4,082, a reading that reflects how fast the slide arrived rather than how far it can run.
The Argument That This Is the Low
The bullish case is built on exhaustion rather than on any improvement in demand.
- The daily RSI touched 19.95 on Saturday and remains near 23
- Bitcoin is 8.5% under its 200-week average, deeper than the 7.3% seen at the June low
- 51.5% of all circulating coins are held at a loss
- Short-term holders picked up roughly 66,000 BTC between $62,000 and $66,000
Vetle Lunde, head of research at K33, described anything below $70,000 as a gift from the market and pointed out that similar setups have preceded bottoms. Matt Hougan, chief investment officer at Bitwise, argues the rate decision is already in the price and the leverage has been cleared.
Glassnode pushes back. Its analysts see buying demand as thin, and warn that a daily close below $62,000 would leave August’s buyers underwater and point at $58,500. The Crypto Fear and Greed Index at 11 is lower than it was at the June bottom, and 68% of accounts on the biggest exchange are still positioned long.
Ether is in a worse spot on fund flows, with seven straight weekly outflows behind it, as the ethereum price prediction sets out.
What the Numbers Look Like Over a Longer Window
Six consecutive losing weeks has only happened twice before, between January and March of this year and across April and May of 2022. Two prior cases is not a pattern anyone should trade from.

The supply side has not changed. Around 20.11 million of the eventual 21 million coins have been mined, and the whole market is worth $1.27 trillion, down from roughly $2.5 trillion at the October 2025 peak.
None of this is advice. A 15% weekly move is ordinary for this asset now, and that works in both directions. Buying with borrowed money pins a fixed repayment to a price that halved in 13 months, and a missed payment sits on your credit score for years.
Frequently Asked Questions
What is the short term bitcoin price prediction?
The range is $62,361 to $65,607. A daily close under $62,000 opens $58,500, the June low. A close above $66,583 makes $70,000 the next thing to argue about. Nothing beyond those levels is worth much right now.
Why are Bitcoin ETFs seeing such large outflows?
October inflation of 0.4%, reported on November 10, turned a possible December rate rise into an expected one and investors cut risk. The selling is concentrated: IBIT is 87% of the $2.58 billion that has left since November 2.
How much has Bitcoin fallen from its record?
About 50%. The record close to close high was $126,080 on October 6, 2025, so getting back there means doubling from $63,200.
Is Bitcoin oversold at these levels?
On the standard measures it is. RSI under 20, more than half of supply at a loss, and a larger gap below the 200-week average than at the June low. Oversold markets can stay oversold, so it marks risk rather than a signal.