The richest country in the world, measured by output per resident, is Liechtenstein: $192,328 per person in 2025 at purchasing power parity in the International Monetary Fund’s October 2026 World Economic Outlook. Singapore, Luxembourg, Ireland and Qatar follow, and every country in the top ten except the United States has fewer than ten million people.
A high figure does not mean every resident is rich. This guide lists the ten, groups them by the engine that produces the income, and shows where gross national income and tax statistics cut the headline down.
Richest Country in the World Under Three Yardsticks
Liechtenstein is the richest country in the world on both IMF yardsticks: $192,328 per person at PPP and $218,978 at market exchange rates in 2025. Among the ten, Singapore leads World Bank gross national income per capita (PPP) at $135,750; the World Bank reports no figure for Liechtenstein.
- PPP GDP per capita: output per resident, adjusted so a dollar buys the same basket everywhere. This is the ranking below.
- Nominal GDP per capita: output per resident at market exchange rates, so high-price countries rise and low-price ones fall.
- Gross national income per capita: income earned by residents, wherever it is produced, which removes commuter wages and foreign-owned profit.
Ranking the Top 10 by PPP Income, With the 2026 Forecast and Nominal Income
| # | Country | PPP 2025 | PPP 2026 (projected) | Nominal 2025 | Population (millions) |
|---|---|---|---|---|---|
| 1 | Liechtenstein | $192,328 | $198,987 | $218,978 | 0.04 |
| 2 | Singapore | $164,244 | $176,927 | $99,365 | 6.1 |
| 3 | Luxembourg | $152,894 | $156,638 | $148,247 | 0.68 |
| 4 | Ireland | $147,825 | $149,642 | $123,789 | 5.5 |
| 5 | Qatar | $119,556 | $103,804 | $67,894 | 3.2 |
| 6 | Norway | $111,462 | $116,169 | $94,360 | 5.6 |
| 7 | Switzerland | $102,397 | $106,944 | $117,191 | 9.1 |
| 8 | Brunei | $94,043 | $98,028 | $32,634 | 0.46 |
| 9 | United States | $90,267 | $95,212 | $90,267 | 341.9 |
| 10 | Denmark | $87,303 | $92,876 | $78,587 | 6.0 |
PPP is in international dollars and nominal in US dollars, all from the IMF’s October 2026 release. Only sovereign states are ranked.
Five Engines Behind the Top 10
Each country’s income traces to one of five causes, and several fit more than one:
- Commuter economies: Liechtenstein and Luxembourg count output from workers who live elsewhere.
- Multinational profit: Ireland books output for foreign-owned firms, and Denmark’s pharmaceutical production abroad lifts its GDP.
- Hydrocarbons: Qatar, Norway and Brunei sell oil and gas.
- Trade and finance hubs: Singapore, Switzerland and Luxembourg’s funds.
- Scale and productivity: the United States.
The 10 Richest Countries Ranked, Profile by Profile
1. Liechtenstein: Finance on Top of Industry

PPP: $192,328 | 2026 projection: $198,987 | Nominal: $218,978
The IMF puts the financial sector, mainly private banking, wealth management, insurance and trust services, at roughly 20 percent of Liechtenstein’s GDP, with roughly half of all workers commuting in, 59 percent of them from Switzerland and 37 percent from Austria.
That commuter workforce explains the gap between output and income. The IMF’s 2025 Selected Issues paper says the GDP-GNI gap is significant, mainly because of net outflows to foreign workers rather than multinational profit shifting. The government’s table above shows CHF 186,844 of GDP per resident against CHF 117,857 for Luxembourg, and it puts GNI per capita at about CHF 149,000 for 2022, the highest among EU and EFTA states.
2. Singapore: Trade and Manufacturing Lead a Mixed Economy

PPP: $164,244 | 2026 projection: $176,927 | Nominal: $99,365
The Economic Development Board shows 2025 nominal GDP of S$789.5 billion by industry, with wholesale trade and manufacturing the largest sectors, and describes Singapore as the second largest recipient of foreign direct investment in the world.
Growth has stayed strong: the Department of Statistics’ advance estimate was 5.4 percent year-on-year in the third quarter of 2026, moderating from 6.2 percent in the second. Investment is steady too, with gross fixed capital formation of S$174.4 billion in 2025, about 22 percent of GDP.
3. Luxembourg: Nearly Half the Workforce Lives Abroad

PPP: $152,894 | 2026 projection: $156,638 | Nominal: $148,247
At the end of 2025 Luxembourg had nearly 494,000 employees, and 47 percent were cross-border workers, according to STATEC, the national statistics institute. Only one in four employees held Luxembourg nationality.
Fund assets have kept growing alongside them: EUR 5,028.5 billion at the end of 2022 and EUR 6,731.3 billion in June 2026, the CSSF reported, even as the number of funds fell from 3,377 to 2,968.
4. Ireland: Ten Companies Pay 56 Percent of the Tax

PPP: $147,825 | 2026 projection: $149,642 | Nominal: $123,789
Corporation tax shows the distortion from the tax side. The Revenue Commissioners reported that the ten largest companies paid 56 percent of net corporation tax receipts in 2025, and foreign-owned multinationals paid EUR 28.8 billion, 87 percent of the total.
Domestic companies paid EUR 2.4 billion, 7 percent, and Irish-owned multinationals EUR 1.8 billion, 5 percent. An economy built on a few firms swings with their accounts: GDP grew 8.0 percent in 2025 while GNI* grew 4.7 percent.
5. Qatar: Surpluses Built on LNG
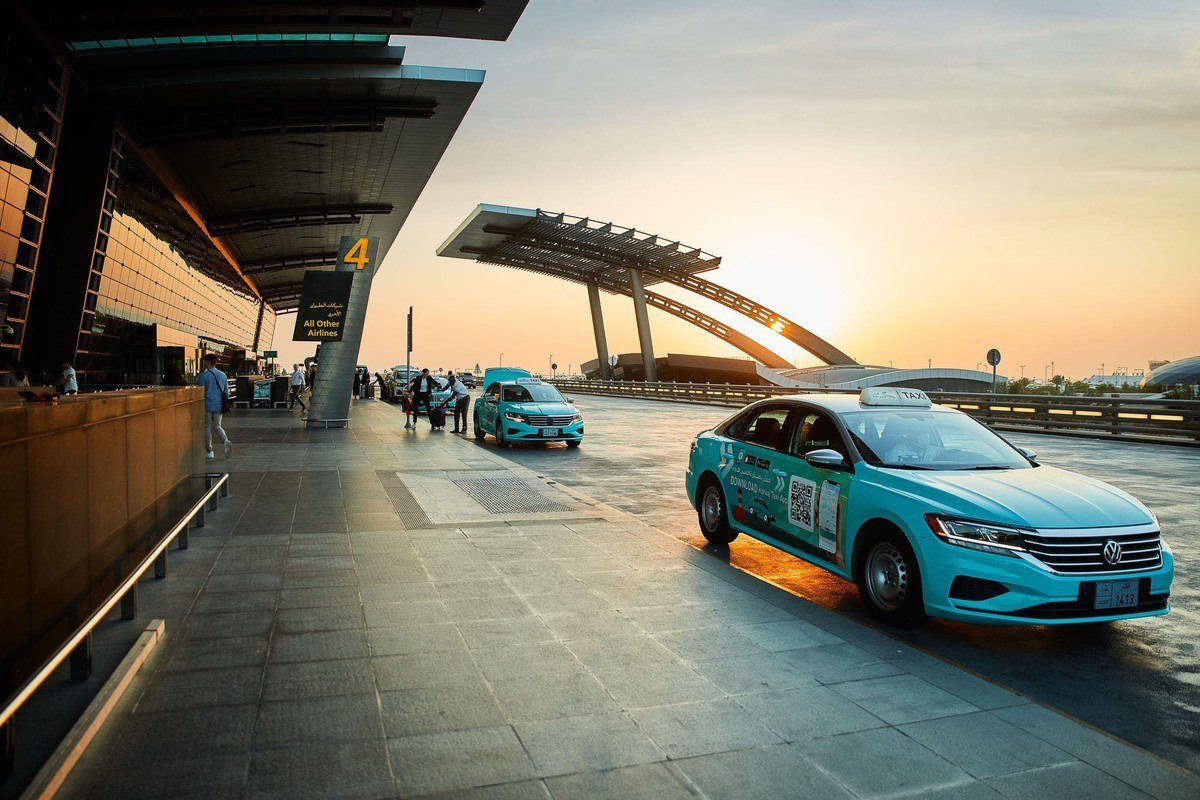
PPP: $119,556 | 2026 projection: $103,804 | Nominal: $67,894
The IMF’s 2024 Article IV report shows what hydrocarbons did for the public accounts: a current account surplus of 17 percent of GDP and a fiscal surplus of 5.5 percent in 2023, with per capita income of US$69,541 for 3.1 million people. It expected growth to average 4.75 percent as LNG output expands.
Residents keep nearly all of it: World Bank GNI per capita (PPP) of $126,290 in 2025 sits just below GDP per capita of $128,883. The IMF still urges diversification, including a value-added tax, because hydrocarbon prices drive the surpluses.
6. Norway: A Small Producer, a Big Exporter

PPP: $111,462 | 2026 projection: $116,169 | Nominal: $94,360
Crude oil, gas, NGL and condensate exports were worth about NOK 1,000 billion in 2025, or 57 percent of goods exports, according to Norwegianpetroleum.no, run by the Ministry of Energy and the Norwegian Offshore Directorate.
Norway produces only about 2 percent of global crude demand and about 3 percent of gas demand, yet it is the fourth largest gas exporter, behind Russia, Qatar and the United States, and its 2025 gas exports equalled more than 30 percent of EU and UK consumption.
7. Switzerland: Finance Is 9 Percent of GDP
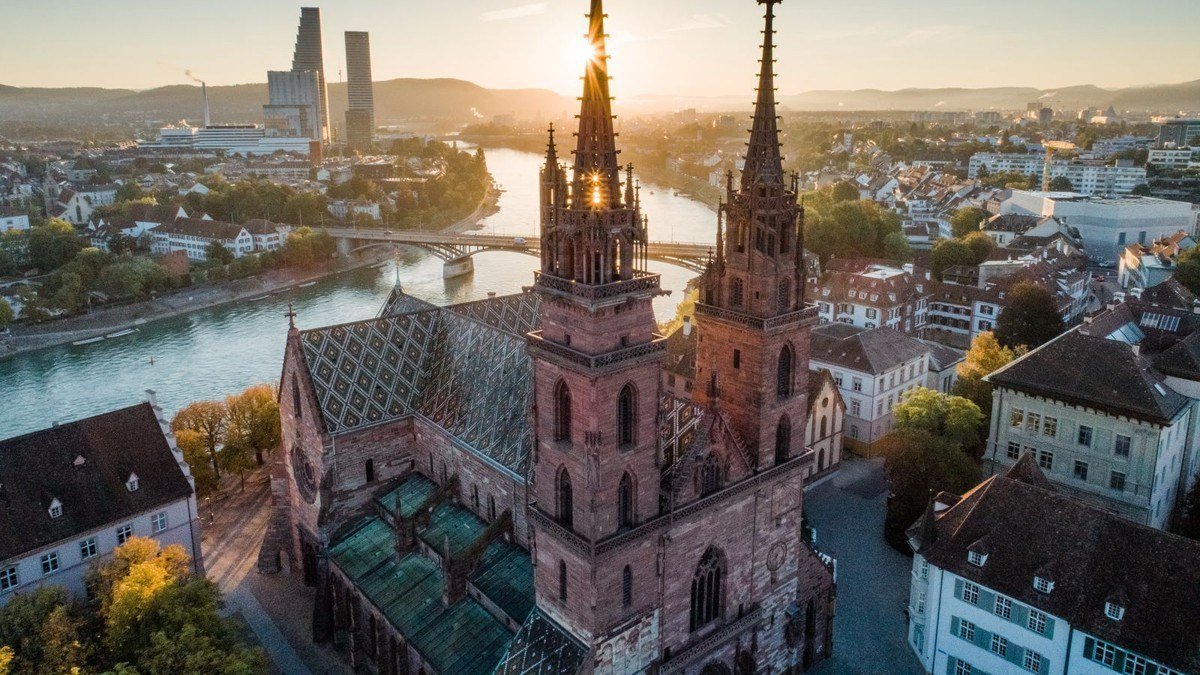
PPP: $102,397 | 2026 projection: $106,944 | Nominal: $117,191
The Swiss financial sector added CHF 74.0 billion of value in 2024, 9.0 percent of a CHF 824.6 billion GDP, the State Secretariat for International Finance reported. Banks contributed CHF 42.1 billion and insurers CHF 31.9 billion.
The share has been falling, from 9.9 percent in 2014, as other sectors grew faster; customs data show chemicals and pharmaceuticals at 53 percent of 2025 exports. Switzerland is fourth by nominal income but seventh by PPP, because Swiss prices run above US prices.
8. Brunei: Diversifying Slowly
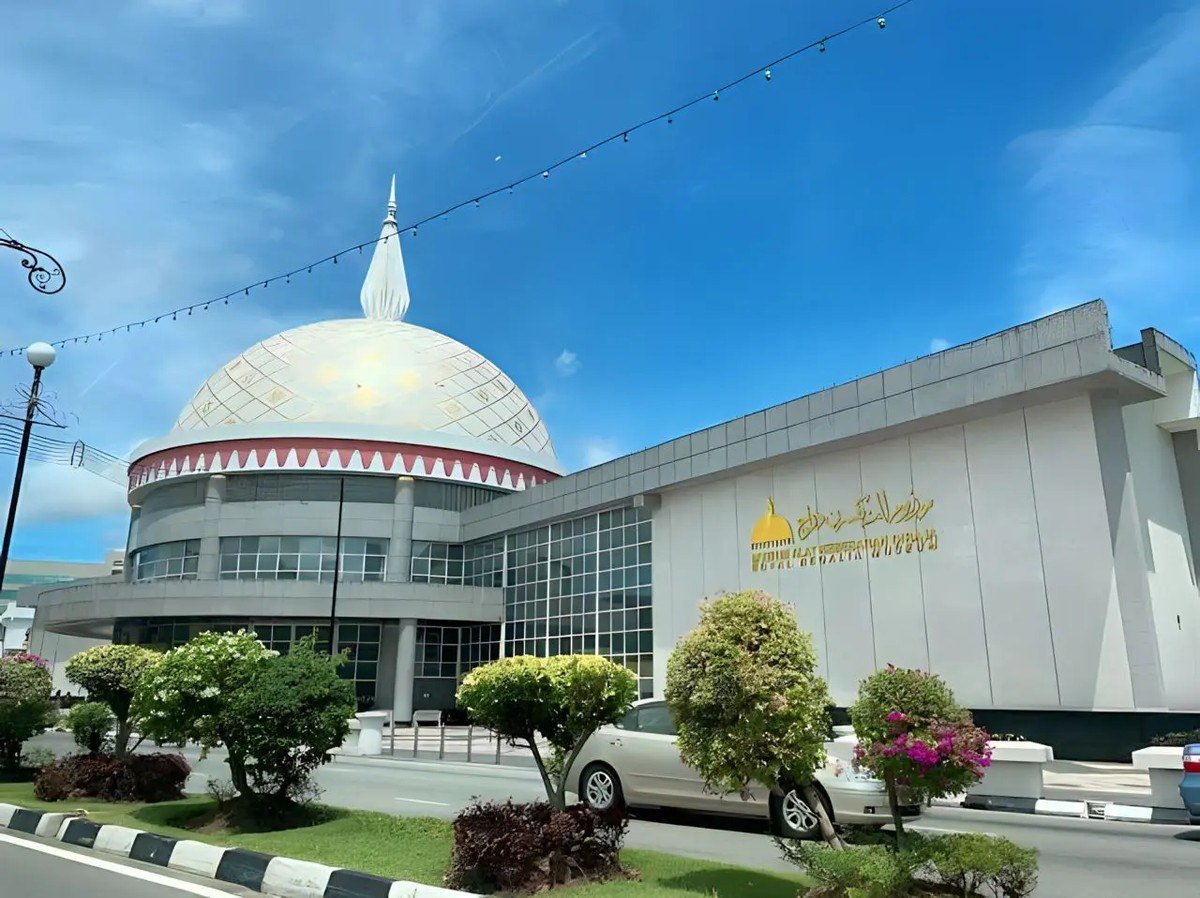
PPP: $94,043 | 2026 projection: $98,028 | Nominal: $32,634
Oil and gas made up 42.2 percent of Brunei’s exports in the third quarter of 2025, with other goods at 57.8 percent. The statistics department notes that the downstream oil and gas industry is the key driver of those non-oil exports.
In the same quarter the oil and gas sector grew 2.0 percent on higher natural gas and LNG output while the rest of the economy shrank 1.8 percent. World Bank GNI per capita (PPP) of $95,420 in 2025 is slightly above GDP per capita of $92,430.
9. United States: Productivity at Scale

PPP: $90,267 | 2026 projection: $95,212 | Nominal: $90,267
Nonfarm business labor productivity rose 2.1 percent in 2025, the Bureau of Labor Statistics reported, as output grew 2.5 percent on 0.4 percent more hours. Anyone earning independently there can see how rates and tax interact in our freelancing tips.
The Census Bureau’s real median household income was $87,460 in 2025, a record, and $76,060 after taxes. It measures the middle household, not the average resident, which makes it a useful second look at the GDP figure.
10. Denmark: GDP Outruns GNI

PPP: $87,303 | 2026 projection: $92,876 | Nominal: $78,587
Danmarks Nationalbank said on 23 September 2026 that this year’s strong GDP growth is driven by an extraordinary increase in the pharmaceutical industry’s production abroad, and that the growth does not bring a corresponding rise in prosperity measured by GNI.
World Bank GNI per capita (PPP) of $85,460 in 2025 was above GDP per capita of $83,218, but the projection column shows the risk: at $92,876 for 2026, Denmark ranks eleventh and drops out of the top ten.
How Gross National Income Re-sorts the Table
The World Bank’s 2025 gross national income per capita (PPP) puts the countries in a different order:
- Singapore: $135,750
- Qatar: $126,290
- Norway: $107,770
- Luxembourg: $106,640
- Ireland: $106,310
- Switzerland: $101,690
- Brunei: $95,420
- United States: $89,490
- Denmark: $85,460
The World Bank reports no figure for Liechtenstein. Luxembourg loses 32 percent against its GDP figure of $156,542 and Ireland 31 percent against $155,089. Norway and Denmark gain. For how far one person’s earnings can sit from any national average, see our breakdown of what YouTubers make per view. This article is general information, not financial advice.
Macao, Hong Kong and Taiwan: Three Economies Left Out
The IMF labels Macao and Hong Kong special administrative regions and Taiwan a province of China. Macao’s $134,421 PPP would rank fifth, and its government reports 226.782 billion patacas of gaming revenue in 2024 against a GDP of 403.3 billion patacas. Taiwan’s $90,256 is $11 short of the United States, and Hong Kong’s is $80,408.
Monaco is missing for a different reason: the IMF outlook does not cover it at all. World Bank figures put its GDP per capita at $288,002 for 2024, above Liechtenstein’s $220,167 on the same nominal measure.
Reading the 2026 Forecast Column
The IMF projects Qatar at $103,804 for 2026, 13 percent lower, and its country page shows real GDP shrinking 8.6 percent. Guyana is the new entrant: projected at $98,912, up 24 percent, as oil output averaged about 902,000 barrels a day in the first half of 2026, up from 639,000 a year earlier. The IMF revises forecasts in every outlook.
Total Output Is a Different List: the Five Largest Economies
By nominal GDP in 2025 the IMF ranks:
- United States: $30,861 billion
- China: $19,626 billion
- Germany: $5,116 billion
- Japan: $4,453 billion
- United Kingdom: $4,012 billion
Frequently Asked Questions
Why is Ireland’s GDP per capita so high?
Multinational-dominated sectors produced 50.4 percent of Irish value added in 2025. The Central Statistics Office measures GDP at EUR 602.4 billion but GNI*, which strips out globalisation effects, at EUR 334.0 billion.
Which country has the highest GDP overall?
The United States, at $30,861 billion in 2025, ahead of China at $19,626 billion. Germany is third at $5,116 billion.
What is the richest country in Europe?
Liechtenstein, at $192,328 of GDP per capita (PPP) in 2025. Luxembourg is second in Europe at $152,894 and Ireland third at $147,825.
Does a higher GDP per capita mean people are richer?
Not always. GDP counts output inside a country whoever owns it, so Luxembourg’s GNI per capita is 32 percent below its GDP per capita. Median household income is a closer guide to what a typical household holds.