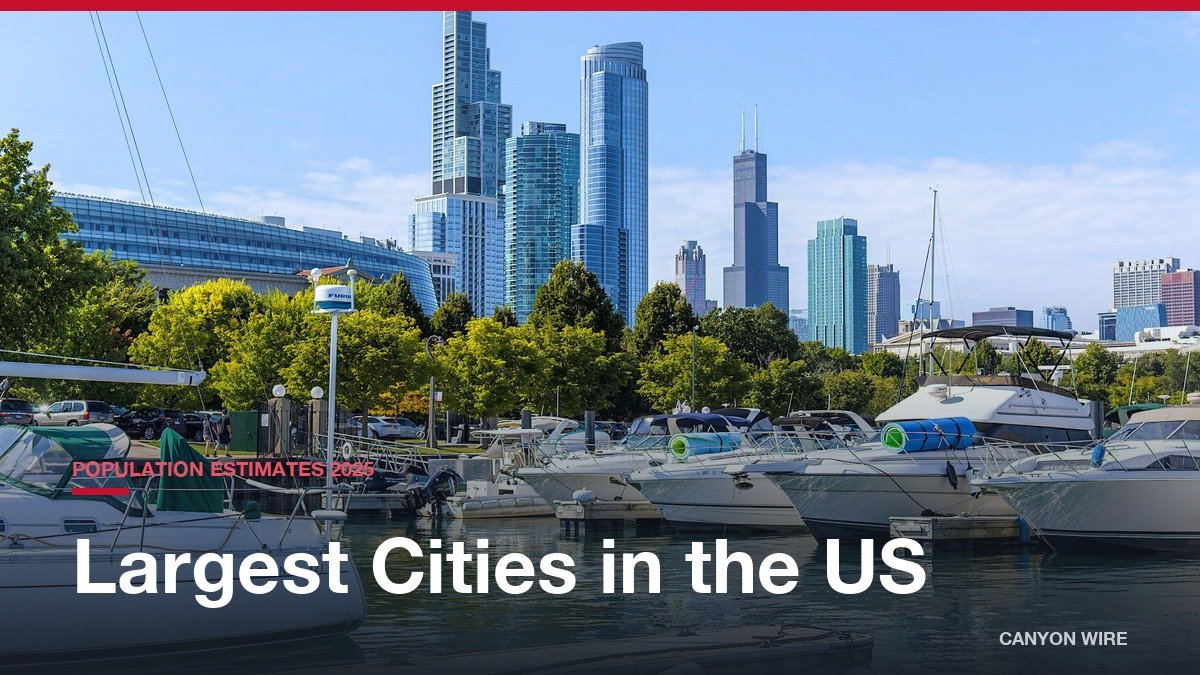
New York City tops the largest cities in the US in 2026 with 8,584,629 residents, a lead of 4,715,540 over Los Angeles in second place. Chicago, Houston and Phoenix follow, and the order of the nine biggest cities has not changed since 2020.
The table below uses the Census Bureau’s Vintage 2025 estimates, published in May 2026. Population is the July 1, 2025 estimate, and change is measured from the April 1, 2020 estimates base. Percentages and densities are computed from the Bureau’s published figures. Ten of the 15 largest cities have grown since the base, five have shrunk, and four of the ten biggest sit in Texas.
Population, Growth, Land Area and Density for the 15 Biggest US Cities
| # | City | Population (July 1, 2025) | Change since April 2020 | Land area (sq mi) | People per sq mi |
|---|---|---|---|---|---|
| 1 | New York City, New York | 8,584,629 | -220,965 (-2.5%) | 300.5 | 28,569 |
| 2 | Los Angeles, California | 3,869,089 | -30,253 (-0.8%) | 470.5 | 8,223 |
| 3 | Chicago, Illinois | 2,731,585 | -16,748 (-0.6%) | 227.7 | 11,994 |
| 4 | Houston, Texas | 2,397,315 | +97,666 (+4.2%) | 640.8 | 3,741 |
| 5 | Phoenix, Arizona | 1,665,481 | +57,132 (+3.6%) | 518.4 | 3,213 |
| 6 | Philadelphia, Pennsylvania | 1,574,281 | -29,519 (-1.8%) | 134.3 | 11,720 |
| 7 | San Antonio, Texas | 1,548,422 | +115,074 (+8.0%) | 499.0 | 3,103 |
| 8 | San Diego, California | 1,406,106 | +21,625 (+1.6%) | 326.0 | 4,313 |
| 9 | Dallas, Texas | 1,329,491 | +25,150 (+1.9%) | 339.7 | 3,914 |
| 10 | Fort Worth, Texas | 1,028,117 | +109,225 (+11.9%) | 352.0 | 2,921 |
| 11 | Jacksonville, Florida | 1,017,689 | +68,082 (+7.2%) | 747.3 | 1,362 |
| 12 | Austin, Texas | 1,002,632 | +44,481 (+4.6%) | 325.0 | 3,085 |
| 13 | San Jose, California | 989,814 | -23,507 (-2.3%) | 177.9 | 5,563 |
| 14 | Charlotte, North Carolina | 964,784 | +90,076 (+10.3%) | 312.1 | 3,091 |
| 15 | Columbus, Ohio | 938,396 | +32,181 (+3.6%) | 221.9 | 4,228 |
Largest Cities in the US, Ranked From New York to Fort Worth
1. New York City: A Lead of 4.7 Million Residents
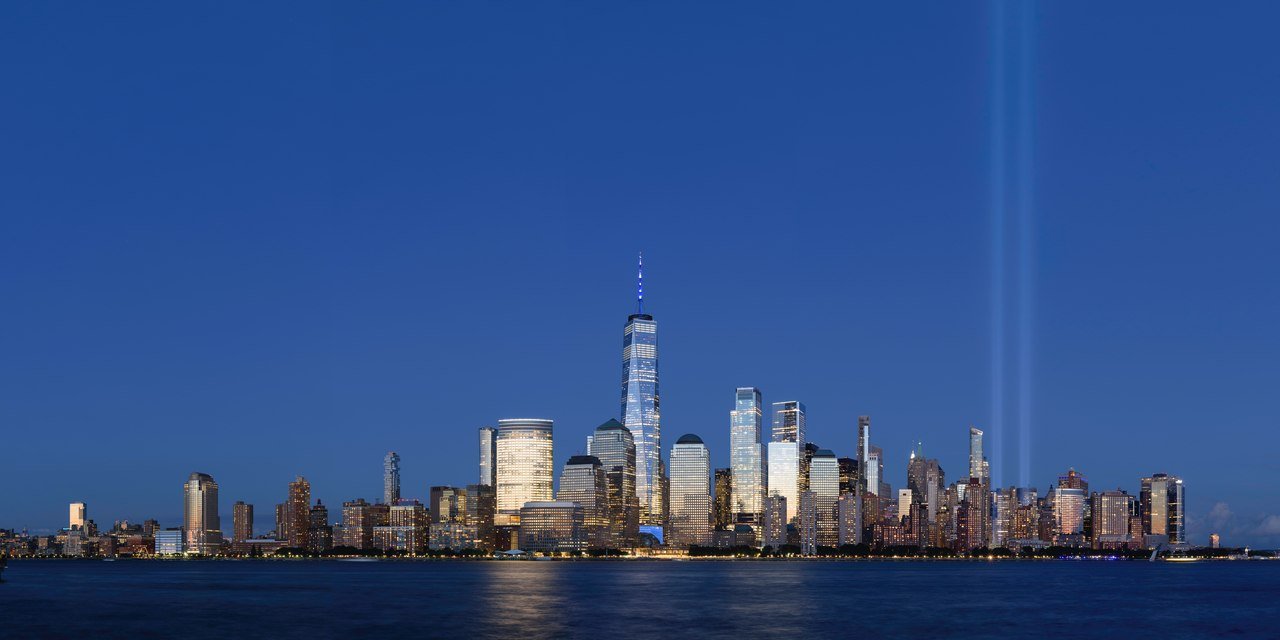
Population: 8,584,629 · Change since 2020: -220,965 (-2.5%) · Land area: 300.483 sq mi · Density: 28,569 per sq mi
The city’s estimates base in April 2020 was 8,805,594, so it has lost 220,965 residents in the years since. Its margin over Los Angeles is 4,715,540 people, which is a ratio of 2.2 to 1.
From July 2024 to July 2025 it dropped by 12,196, the biggest numeric decrease of any US city. Even so, no other city comes close on crowding: 28,569 people per square mile of land is nearly ten times Fort Worth’s 2,921.
2. Los Angeles: Almost Level With 2020
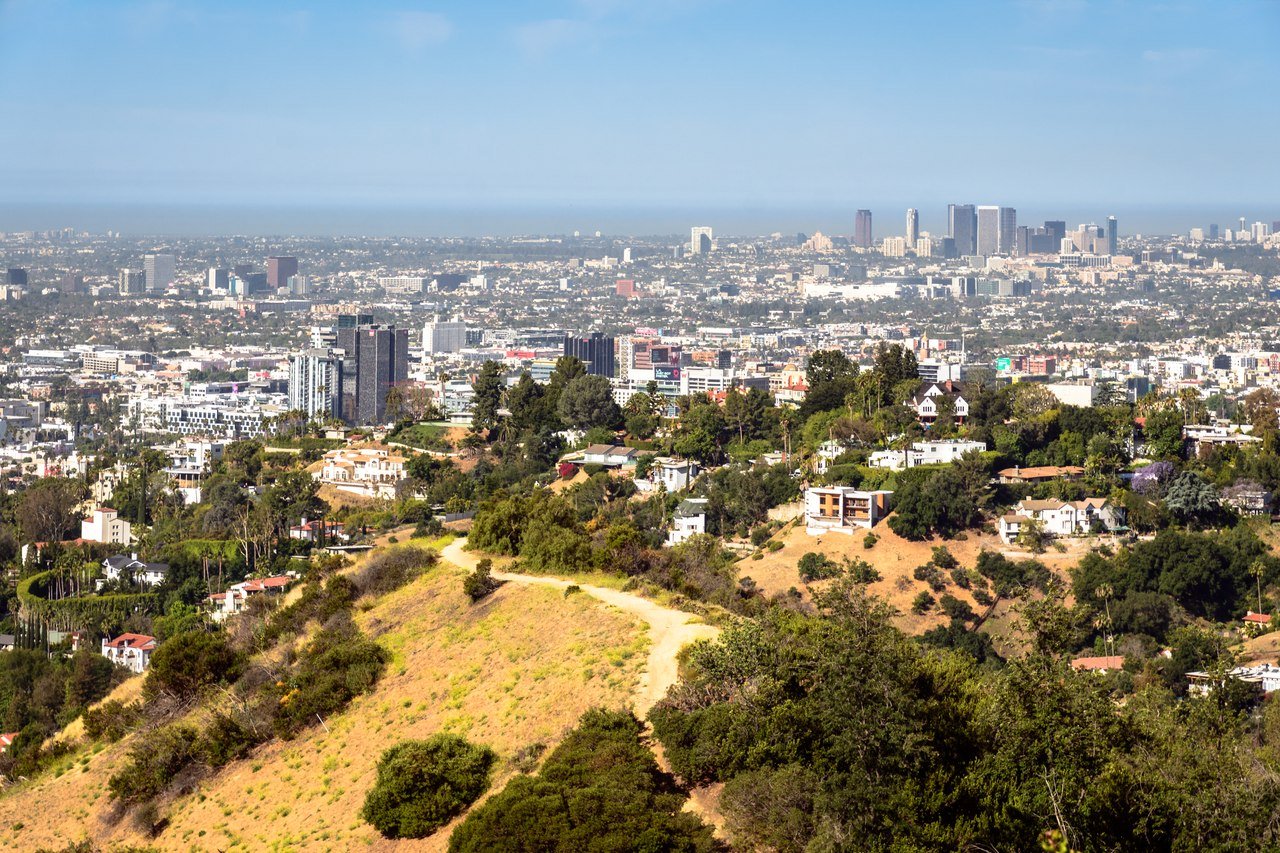
Population: 3,869,089 · Change since 2020: -30,253 (-0.8%) · Land area: 470.518 sq mi · Density: 8,223 per sq mi
The April 2020 base was 3,899,342, and the July 2025 estimate sits just 30,253 below it. The latest year cost the city another 3,621 residents, a mild slide next to New York’s.
Los Angeles is 1,137,504 residents ahead of Chicago, or 1.4 times its size. It spreads over 470.518 square miles, which gives 8,223 people per square mile, less than a third of New York’s figure.
3. Chicago: 5,253 Gained in a Year, 16,748 Still to Recover
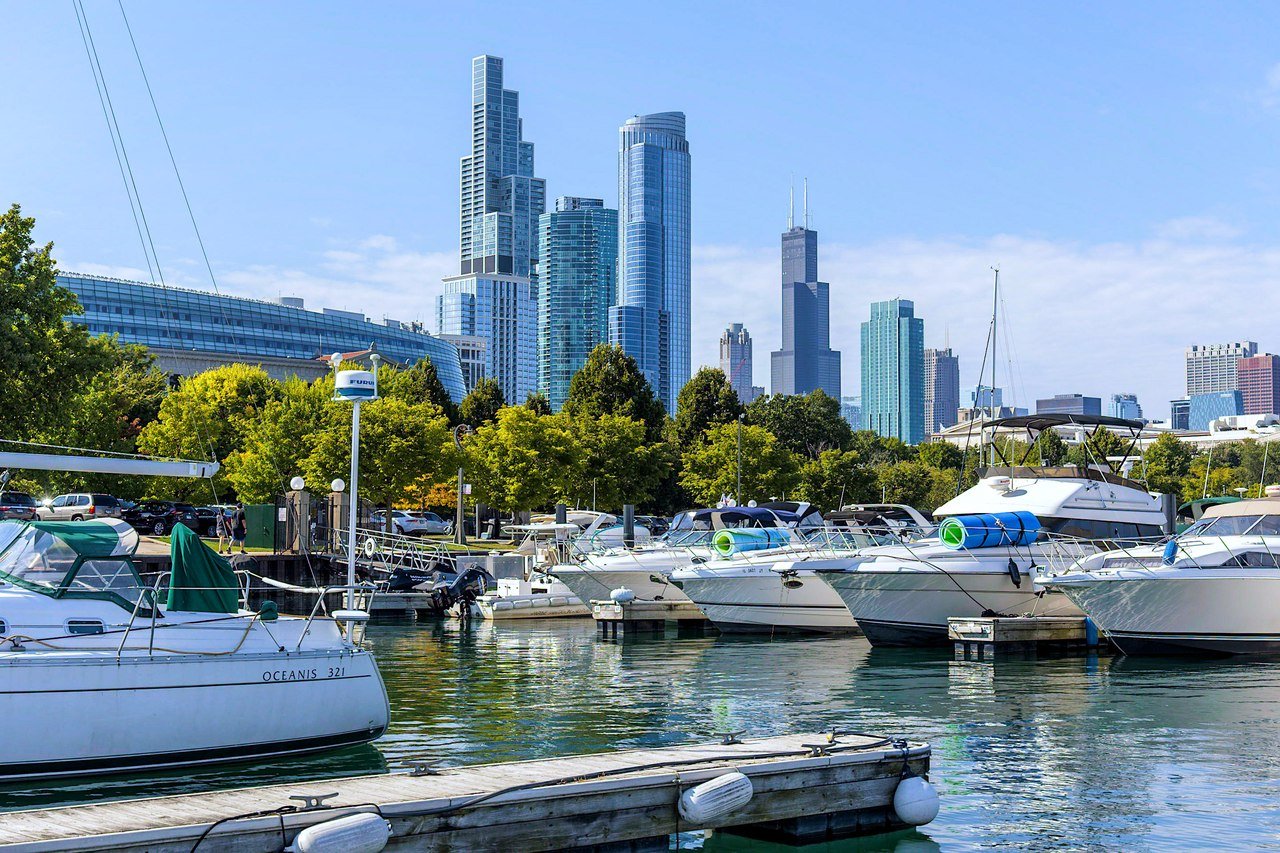
Population: 2,731,585 · Change since 2020: -16,748 (-0.6%) · Land area: 227.748 sq mi · Density: 11,994 per sq mi
Chicago turned positive in the latest year, adding 5,253 residents for a 0.19% rise. That was not enough to get back to its April 2020 base of 2,748,333.
It is 334,270 residents ahead of Houston while occupying about a third of Houston’s land. Its 11,994 people per square mile make it the second most crowded city in the top 15.
4. Houston: 97,666 New Residents on 641 Square Miles
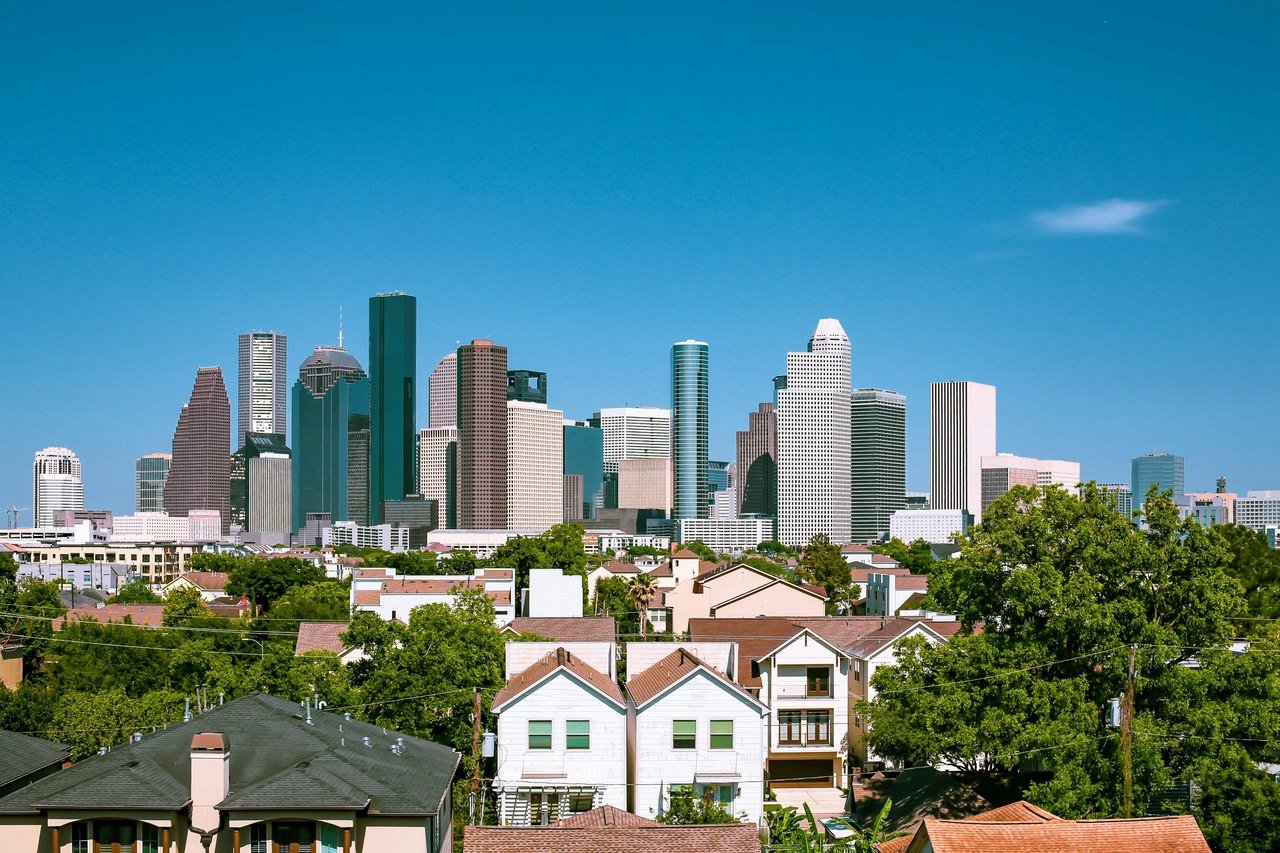
Population: 2,397,315 · Change since 2020: +97,666 (+4.2%) · Land area: 640.819 sq mi · Density: 3,741 per sq mi
Houston rose from 2,299,649 at the April 2020 base to 2,397,315. Its gain of 11,515 between 2024 and 2025 ranks sixth among all US cities of 20,000 or more.
The city covers 2.1 times the land of New York, the widest footprint in the top 10. It holds roughly 30% of the 7,904,627 people in the Houston metro area, the fifth largest in the country.
5. Phoenix: Up 57,132 and Holding Fifth Place
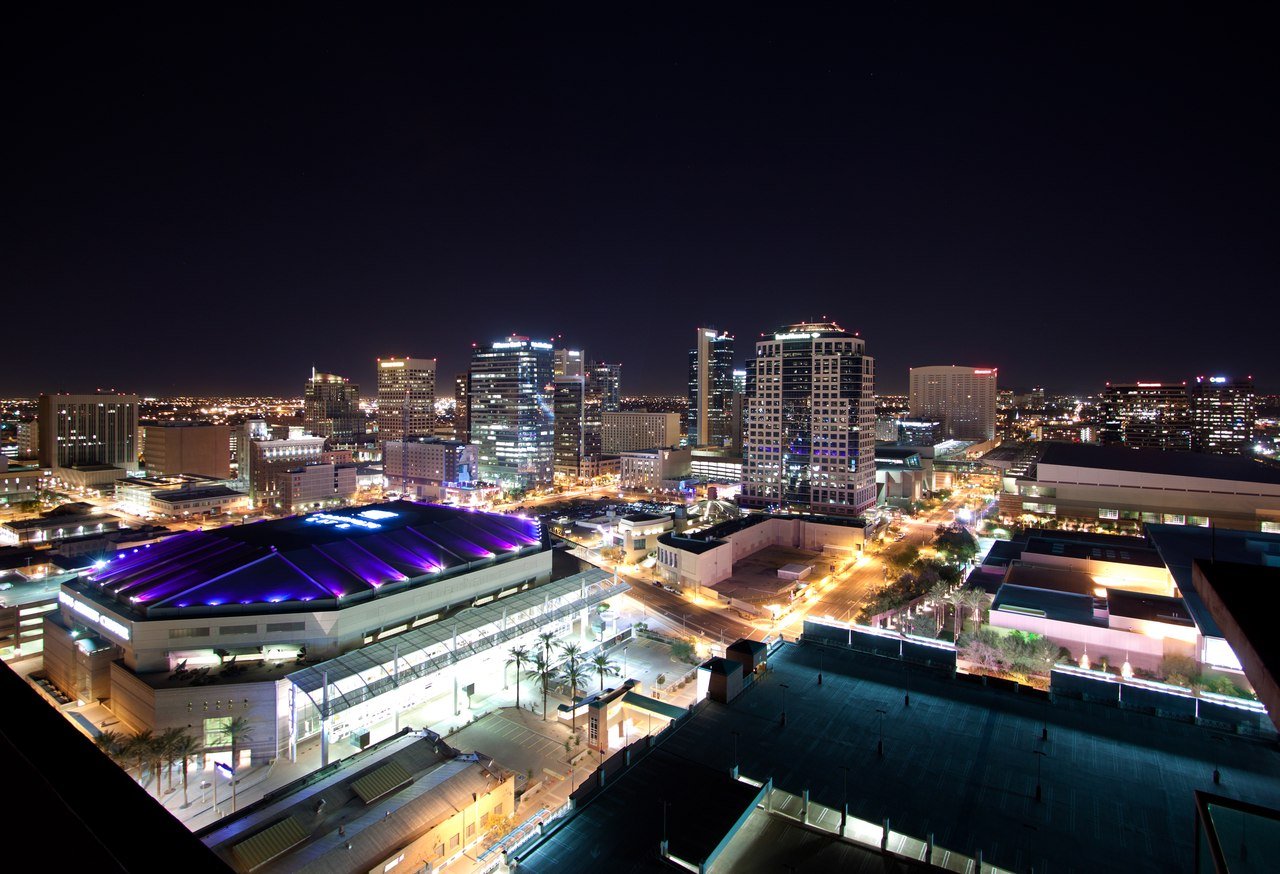
Population: 1,665,481 · Change since 2020: +57,132 (+3.6%) · Land area: 518.423 sq mi · Density: 3,213 per sq mi
Phoenix has grown from 1,608,349 to 1,665,481 since the April 2020 base. The latest year added 3,157 residents, a 0.19% increase, so the pace has cooled to a trickle.
The city leads Philadelphia by 91,200 people. With 518.423 square miles of land and 3,213 people per square mile, it is about as crowded as San Antonio and Austin.
6. Philadelphia: Compact, Crowded and Slightly Smaller
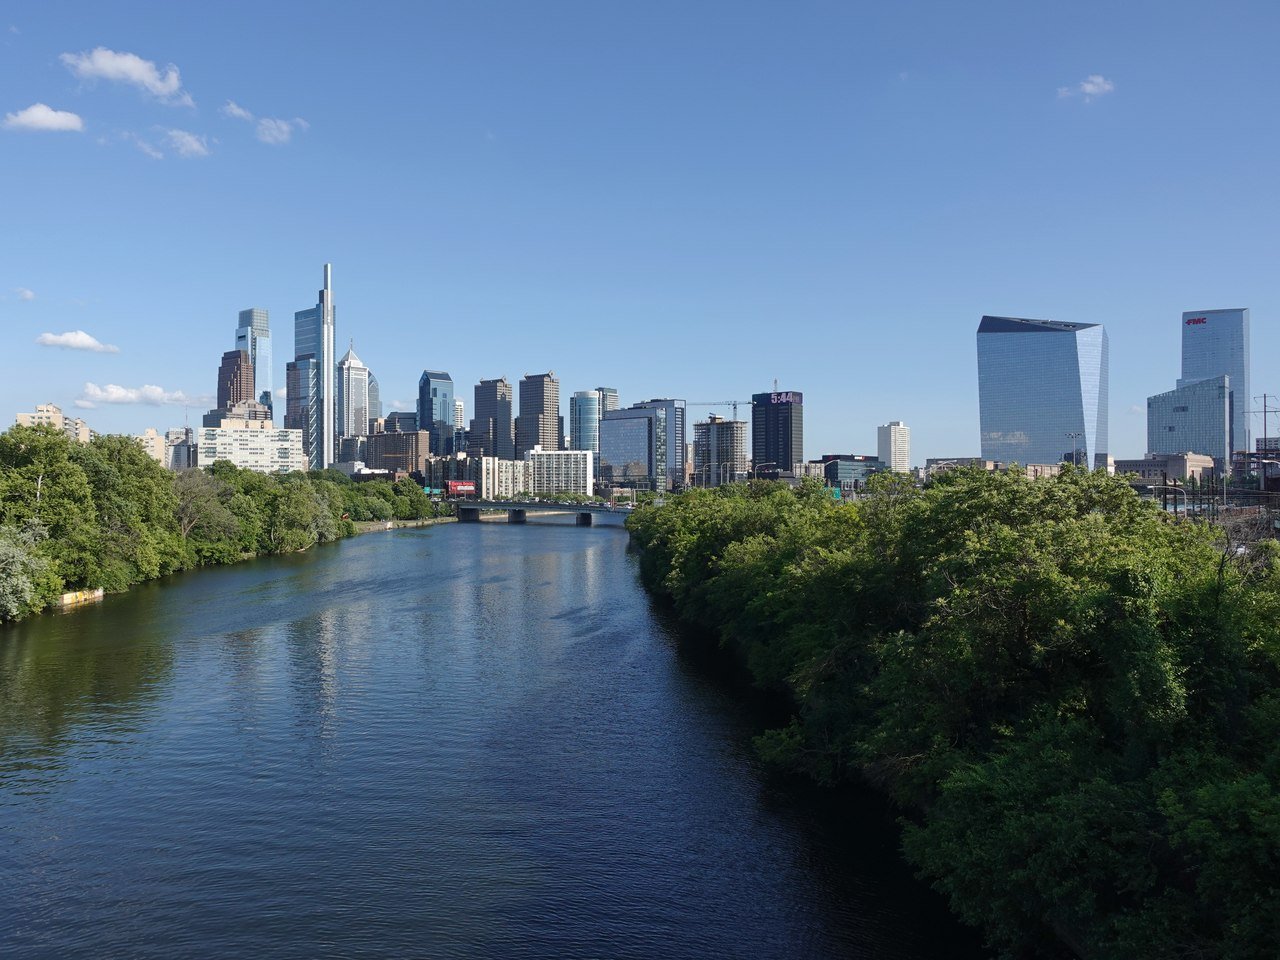
Population: 1,574,281 · Change since 2020: -29,519 (-1.8%) · Land area: 134.325 sq mi · Density: 11,720 per sq mi
Philadelphia’s April 2020 base was 1,603,800, so it is 29,519 residents lighter, although it added 1,546 between 2024 and 2025. It occupies the least land of any city in the top 15, just 134.325 square miles.
Only 25,859 residents now separate it from San Antonio, down from a gap of 170,452 at the 2020 base. Its density of 11,720 per square mile is the third highest in the 15.
7. San Antonio: 115,074 Added and Closing on Philadelphia
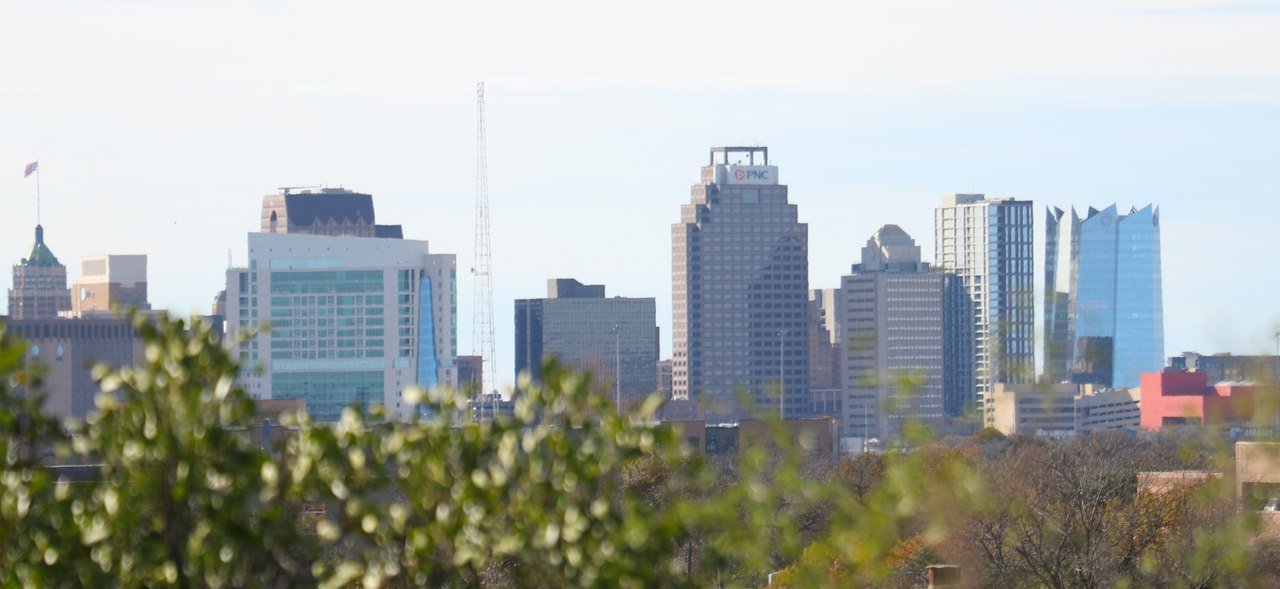
Population: 1,548,422 · Change since 2020: +115,074 (+8.0%) · Land area: 498.979 sq mi · Density: 3,103 per sq mi
From a base of 1,433,348 in April 2020, San Antonio has added more residents than any other city in the top 15. Its 14,359 gain from 2024 to 2025 is the third largest among all cities of 20,000 or more.
It sits 142,316 residents ahead of San Diego. Spread over 498.979 square miles, it has 3,103 people per square mile of land.
8. San Diego: The One Californian Still Growing
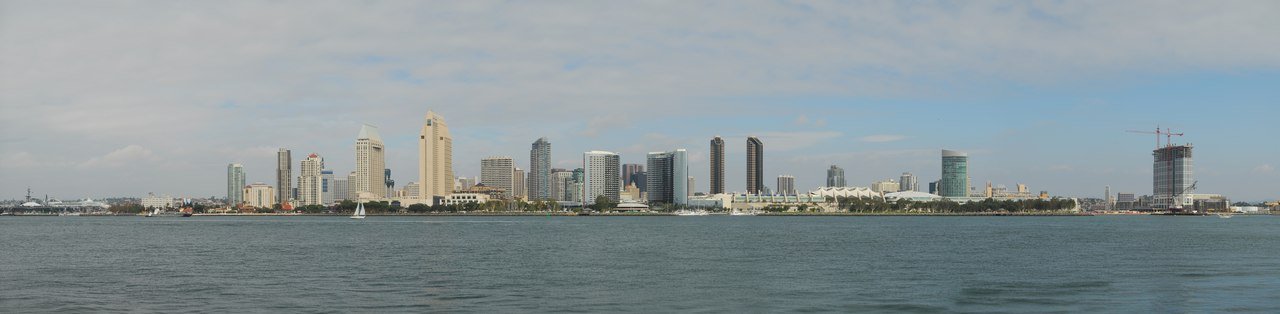
Population: 1,406,106 · Change since 2020: +21,625 (+1.6%) · Land area: 326.028 sq mi · Density: 4,313 per sq mi
San Diego went from 1,384,481 to 1,406,106 since the April 2020 base and added 5,874 residents in the latest year, a 0.42% rise. Of California’s three cities in the top 15, it is the only one above its 2020 level.
Los Angeles is down 0.8% and San Jose is down 2.3%. San Diego leads Dallas by 76,615 residents and has 4,313 people per square mile of land.
9. Dallas: Down in 2025, Up Since 2020
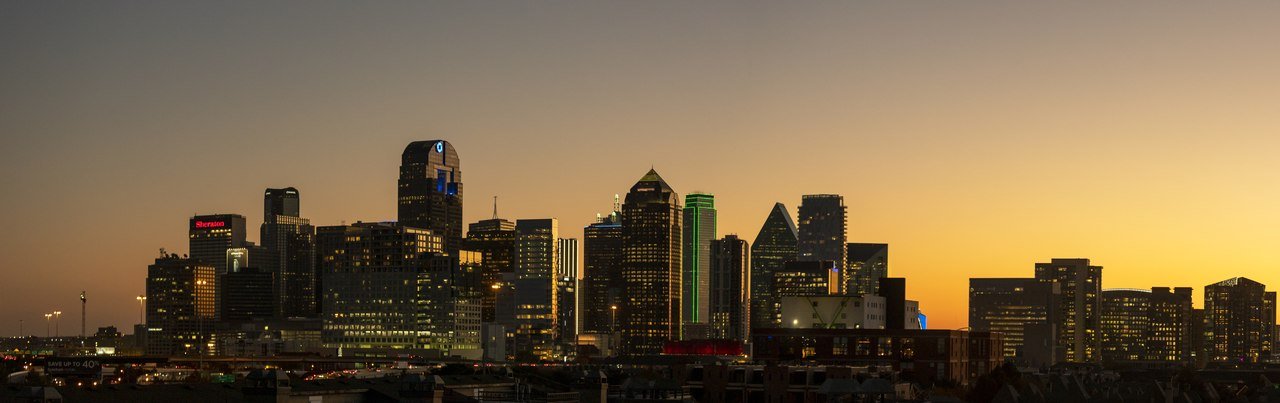
Population: 1,329,491 · Change since 2020: +25,150 (+1.9%) · Land area: 339.685 sq mi · Density: 3,914 per sq mi
Dallas slipped by 1,808 residents between 2024 and 2025, a fall of 0.14%, yet it stands 25,150 above its April 2020 base of 1,304,341. The land area is 339.685 square miles.
The metro area is where the growth shows up. Dallas-Fort Worth-Arlington is up 11.0% since 2020, and Celina, a city inside it, grew 24.6% in the latest year, the fastest rate of any city of 20,000 or more.
10. Fort Worth: Up From 13th to 10th in Five Years
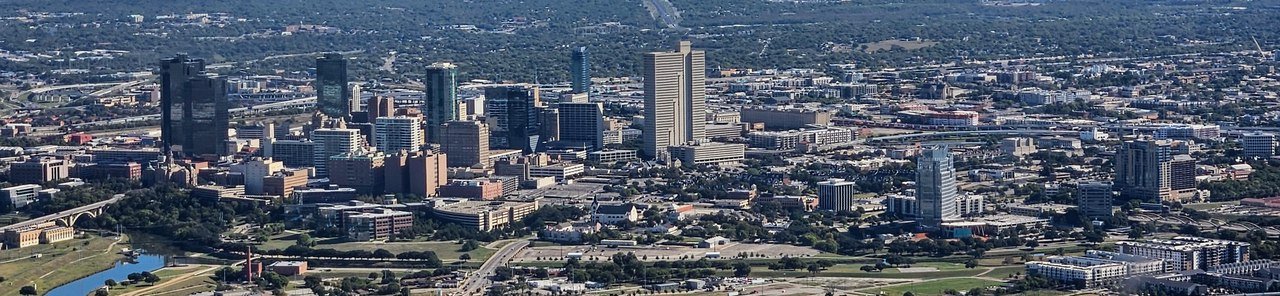
Population: 1,028,117 · Change since 2020: +109,225 (+11.9%) · Land area: 352.011 sq mi · Density: 2,921 per sq mi
Fort Worth ranked 13th at the April 2020 base of 918,892. It overtook Jacksonville in 2025 and now leads it by 10,428 residents.
Its 19,512 gain in the latest year is the second largest of any US city, and its 11.9% rise since 2020 is the fastest in the top 15. At 2,921 people per square mile, it is the least crowded of the ten.
Texas Holds Four of the Top 10 Spots and Five of the Top 15
Houston, San Antonio, Dallas and Fort Worth together hold 6,303,345 residents, and they have grown by 347,115 since the April 2020 base, a combined 5.8%. Add Austin at 12th, which crossed one million between 2024 and 2025, and Texas has five cities in the top 15 holding 7,305,977 people. For where to settle among them, see our guide to the best places to live in Texas.
The suburbs around those cities are growing faster still. The five fastest-growing cities of 20,000 or more in the latest year were all in Texas, led by Celina at 24.6% and Fulshear at 21.0%. Since April 2020, Fulshear has grown 297.3%, from 16,269 to 64,630, and Celina 276.8%, from 17,099 to 64,427.
At metro level, Dallas-Fort Worth-Arlington gained 838,863 residents (+11.0%) to reach 8,477,157, and Houston-Pasadena-The Woodlands gained 754,400 (+10.6%) to reach 7,904,627. New York’s metro area, by comparison, grew just 0.1%.
Density Leaders: Crowded Cores and Cities That Spread Out
Among the 15 biggest cities, density runs from 28,569 people per square mile in New York to 1,362 in Jacksonville. Chicago (11,994) and Philadelphia (11,720) form a second tier, followed by Los Angeles (8,223) and San Jose (5,563). The remaining ten cities sit between 1,362 and 4,313.
Land area explains much of the spread. Jacksonville covers 747.33 square miles, 5.6 times Philadelphia’s 134.325, yet holds 1,017,689 residents against Philadelphia’s 1,574,281. The ten largest cities together hold 26,134,516 people on about 3,809 square miles, an average of roughly 6,860 per square mile.
The Five Big Cities That Shrank, and What Offset the Losses
New York, San Jose, Philadelphia, Los Angeles and Chicago are all below their April 2020 base. Together they lost 320,992 residents, and New York alone accounts for 220,965 of that. San Jose has dropped from 10th place at the base to 13th, and San Francisco, just outside the 15 at 17th, is down 6.0%.
The losses are easing in places. Chicago, Philadelphia and San Jose all grew between 2024 and 2025, adding 5,253, 1,546 and 1,983, while New York and Los Angeles kept falling. The ten growing cities added 660,692 residents, so the 15 together are about 339,700 above their base.
Growth is slowing in general: cities of 250,000 or more averaged 0.3% in the latest year, down from 0.9% the year before. Census Bureau statistician Matt Erickson noted that smaller suburbs in a metro often outgrow the big city at its center. Readers weighing a move can compare costs in our guide to the cheapest states to live in.
What an Estimates Base, a Balance Figure and a Gazetteer Area Mean Here
These are estimates, not census counts, and each new vintage revises the whole 2020 to 2025 series, so the figures belong together only within Vintage 2025. The rankings cover incorporated places, meaning municipalities with legal limits. Only 824 of the 19,483 incorporated places in the data have 50,000 or more residents.
Density is the 2025 population divided by 2025 land area, so it is approximate and ignores water. Indianapolis (16th, 901,116) and Nashville-Davidson (20th, 721,074) are published as balance figures, the consolidated city minus the semi-independent places inside it, and neither affects the top 15. The population data is on the Census Bureau’s city and town totals page.
How to Compare Two Cities Without Mixing Up the Numbers
A fair comparison needs three checks:
- Check the date. Every figure here is a July 1, 2025 estimate, measured against an April 1, 2020 base.
- Check the boundary. A city is the legal limit, while a metropolitan statistical area is an urban core plus the commuting counties around it. New York City has 8.58 million residents and its metro area 20.1 million.
- Check the area. Compare people per square mile, not totals alone: Chicago has 334,270 more people than Houston on 227.748 square miles against Houston’s 640.819.
Metro figures can invert a city ranking. Dallas and Fort Worth rank 9th and 10th as cities with 2,357,608 residents between them, yet their metro is fourth in the country at 8,477,157, about 3.6 times larger.
Frequently Asked Questions
How many people live in the 10 largest US cities combined?
Together they hold 26,134,516 residents on July 1, 2025. New York City accounts for 8,584,629 of them, about a third, and Fort Worth, in tenth place, has 1,028,117.
Which big city has added the most residents since 2020?
San Antonio, with 115,074 more people than its April 2020 base, followed by Fort Worth at 109,225 and Houston at 97,666. In percentage terms Fort Worth leads the top 15 at 11.9%.
Which of the largest cities is the most crowded?
New York City, at 28,569 people per square mile of land. Chicago follows at 11,994 and Philadelphia at 11,720, while Jacksonville, the 11th largest, has 1,362.
Which city most recently passed one million residents?
Austin, at 1,002,632, crossed the line between 2024 and 2025 and became the 12th US city with at least a million people. A further 39 cities have 500,000 or more, after Raleigh passed that mark.